I haven’t started experimenting with different ad networks yet and use standard solutions in my apps: AdMob (banners and interstitials for iOS and banners for Android) + iAd (only banners for iOS). Since Android versions of apps appeared very recently, I have a reliable stats only for iOS.
Ads are mediated through AdMob with the “Optimize AdMob Network” option checked. It results in a much higher number of impressions and higher eCPM for AdMob than for iAd, but I found that this scheme generates the greatest income. It’s important to remember that AdMob works everywhere, while iAd is available only in 16 countries.
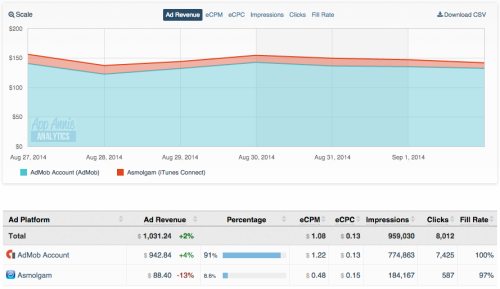
Below, I show the Ads Stats for a typical week in August-September. There are always daily fluctuations in income with Saturday usually being the best day.

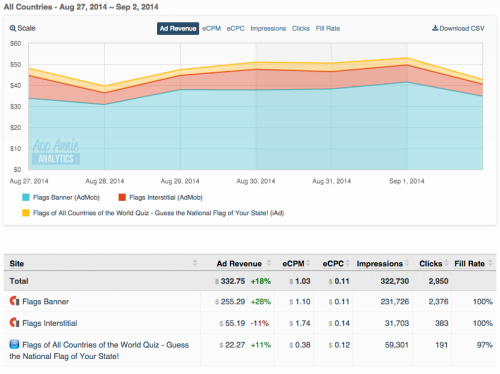
The numbers are self-explanatory for those in mob dev business. My 46 apps bring about $150 and 140k impressions a day. Fill rates are very high and the cost per click is about 15 cents. Of course, these number may vary between apps and countries. Here is the stats for the most profitable app Flags of the World (AdMob banner, AdMob interstitials, iAd banner):

Banners are shown constantly interchanging AdMob/iAd while interstitials are shown after every 15 questions. I’d like to point out that there is an in-app-purchase to remove ads for $0.99 and thus all these stats may be slightly disturbed comparing to actual app usage.
 Flags of the World
 Асмолгамрус
 All My Games