Tag Archives: appannie

Ads Stats

I haven’t started experimenting with different ad networks yet and use standard solutions in my apps: AdMob (banners and interstitials for iOS and banners for Android) + iAd (only banners for iOS). Since Android versions of apps appeared very recently, I have a reliable stats only for iOS.

Ads are mediated through AdMob with the “Optimize AdMob Network” option checked. It results in a much higher number of impressions and higher eCPM for AdMob than for iAd, but I found that this scheme generates the greatest income. It’s important to remember that AdMob works everywhere, while iAd is available only in 16 countries.

Below, I show the Ads Stats for a typical week in August-September. There are always daily fluctuations in income with Saturday usually being the best day.

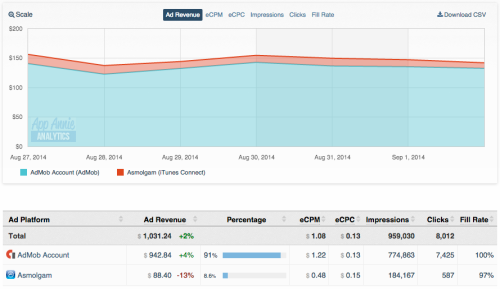
The numbers are self-explanatory for those in mob dev business. My 46 apps bring about $150 and 140k impressions a day. Fill rates are very high and the cost per click is about 15 cents. Of course, these number may vary between apps and countries. Here is the stats for the most profitable app Flags of the World (AdMob banner, AdMob interstitials, iAd banner):

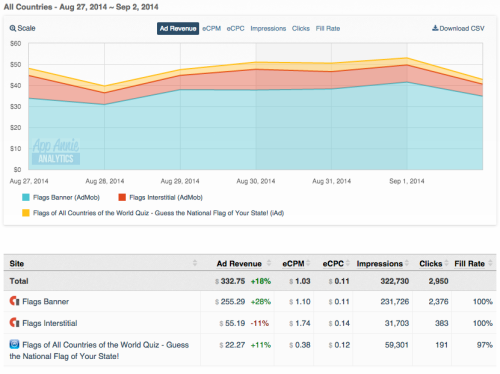
Banners are shown constantly interchanging AdMob/iAd while interstitials are shown after every 15 questions. I’d like to point out that there is an in-app-purchase to remove ads for $0.99 and thus all these stats may be slightly disturbed comparing to actual app usage.

Advertisement

Leave a comment

Filed under Developer Blog

Financial Report – September 2014

All important apps have been rewritten for Android and now I have 46 apps on the Apple App Store (iOS) and 38 apps on the Google Play Store (Android).

Here is my income from Jan 2014 (about $15.5k so far):

In January, I was earning on average $3.5 a day. Since August 20, my daily income haven’t fell below $150 / day. Total income in August is $4,198. This amount is comparable with my salary that I had 2 years ago as a chemistry postdoc at Berkeley.

75% of money are from showing ads and only 25% from sales and in-app-purchases (next week, all my apps can be downloaded for free).

The most profitable are Geography apps, such as:

50 US States (iOS, Android) $2,532 (16.5% of total income).
European Countries (iOS, Android) $2,098 (13.6%).
Flags of the World (iOS, Android) $1,448 (9.5%).

Localization into 9 languages was a very clever decision. United States accounts for 28.4% of total income, Germany 10.9%, Russia 8.8%, France 6.7%, and so on.

The Google Play store is very different from the Apple App store in download trends, search optimization and algorithms. By now, the income from Android apps is just $15.29 but it is constantly growing and I’m just in the beginning of understanding this platform.

Many thanks to everyone who supports me. I will be glad to answer your questions and hear your suggestions how to improve my apps.

7 Comments

Filed under Android, Developer Blog, Finance, Geography